Core Web Vitals are not a static specification. Google has continuously refined which metrics matter, what the thresholds are, and how they weight into ranking signals. If you set your CWV strategy in 2022 and never revisited it, your understanding of what constitutes \u201cgood\u201d performance is out of date.
Here is a precise account of where the metrics stand in 2026, what has changed, and which optimisation levers have the highest return.
INP has replaced FID \u2014 and the bar is higher
The most significant structural change in recent years was the replacement of First Input Delay (FID) with Interaction to Next Paint (INP) as a Core Web Vital.
FID was a narrow metric: it measured only the delay before the browser started processing the first user interaction. A page could have a great FID score but feel sluggish throughout a session because long tasks were blocking the main thread during subsequent interactions.
INP measures the full duration of every interaction \u2014 from user gesture (click, tap, keyboard input) to the next visual paint. It samples all interactions during a session and reports the worst one (excluding outliers). This is a far more honest measure of how responsive a page feels.
SPAs are disproportionately affected by INP
useTransition.INP thresholds
- Good: \u2264 200 ms
- Needs Improvement: 200\u2013500 ms
- Poor:> 500 ms
LCP: image scoring has tightened
Largest Contentful Paint measures when the largest visible element in the viewport \u2014 almost always a hero image or above-the-fold text block \u2014 finishes rendering.
The threshold remains 2.5 s for \u201cgood,\u201d but Google has tightened how it attributes LCP to images served through complex loading pipelines. Key changes to be aware of:
- Images behind
fetchpriority="low"or with lazy loading applied to the LCP element are now penalised more aggressively in Lighthouse 12+. - Animated images (GIFs, animated WebP) are now assessed against the full animation duration, not just the first frame.
- Soft navigations in SPAs are now tracked separately \u2014 LCP is measured after each client-side route transition, not just on initial load.
Prioritise your LCP element explicitly
fetchpriority="high" to your LCP image and make sure it is never lazy-loaded. Then preconnect to the origin serving it: <link rel="preconnect" href="https://cdn.example.com" />. These two changes alone commonly improve LCP by 400\u2013800 ms on image-heavy pages.CLS: the layout shift checklist
Cumulative Layout Shift measures visual instability \u2014 how much page content moves unexpectedly during loading. The good threshold remains 0.1, but the ways that accumulate CLS have multiplied as modern web patterns have evolved.
Common culprits in 2026:
- Dynamic ad slots and third-party embeds that load after the initial paint without reserved space.
- Web fonts causing FOUT/FOIT. Use
font-display: optionalorsize-adjustin your@font-facedeclaration to prevent text from reflowing. - Images without explicit width and height attributes that collapse to zero height until loaded.
- Late-injected banners \u2014 cookie consent overlays, notification prompts, and sale banners that push content down after the initial render.
- CSS animations that affect layout properties (top, left, width, height). Use
transformandopacityinstead.
Measuring CWV correctly
There is an important distinction between field data and lab data that determines whether your CWV scores affect your rankings.
Field data (also called Real User Monitoring or RUM) is collected from actual visitors using the Chrome User Experience Report (CrUX). This is the data Google uses for ranking. Check it in Google Search Console under \u201cCore Web Vitals\u201d or via the CrUX API.
Lab data comes from synthetic tests run by tools like Lighthouse, PageSpeed Insights, or WebPageTest. Lab scores are reproducible and useful for diagnosing issues and measuring the impact of optimisations, but they do not directly correspond to the CrUX data Google ranks you on.
75th percentile, not average
The highest-ROI optimisations right now
Based on the current state of the metrics, these are the changes with the highest expected return for most production sites:
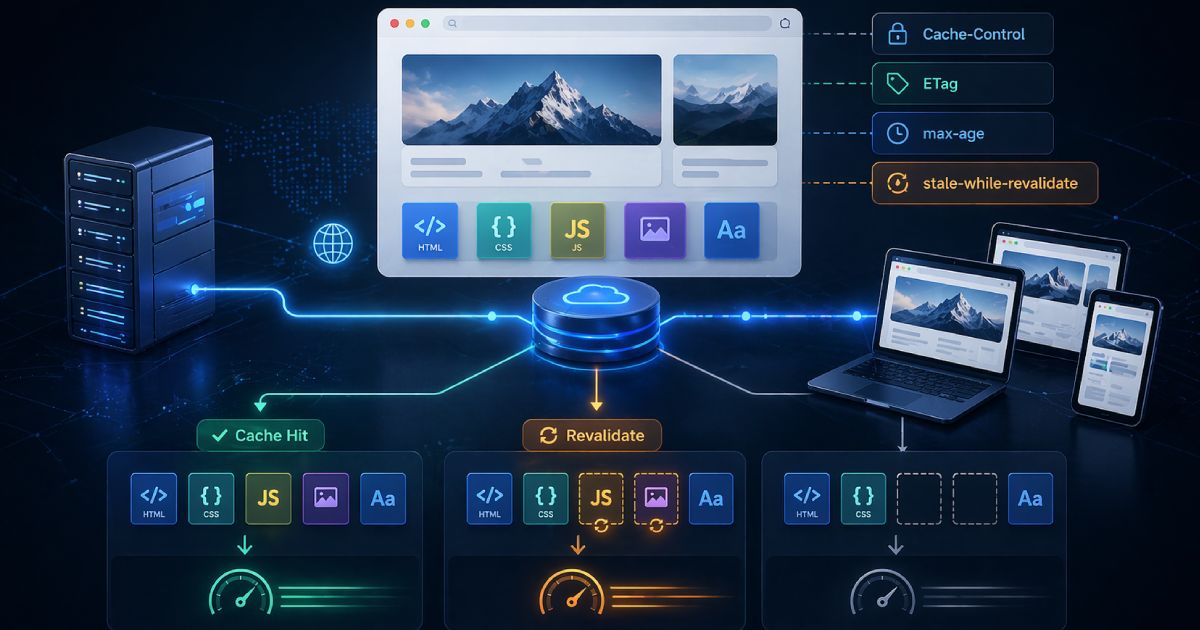
- Audit your LCP element. Add
fetchpriority="high", remove any lazy loading from it, and ensure it is served from a CDN with an appropriateCache-Controlheader. - Run a long-tasks audit using Chrome DevTools Performance panel. Any task over 50 ms is a candidate for
scheduler.yield()or deferred execution. - Reserve space for every dynamic element \u2014 ads, embeds, images \u2014 with explicit dimensions or
aspect-ratioCSS before content loads. - Move cookie/notification banners to a fixed position that does not affect document flow, or inject them before the first paint using SSR.
- Use
content-visibility: autoon below-fold sections to reduce rendering cost of off-screen content.